- Python 58.3%
- HTML 41.7%
| Filename | Latest commit message | Latest commit date |
|---|---|---|
| app | ||
| docs | ||
| tests | ||
| .gitignore | ||
| LICENSE | ||
| nginx-traffic-monitor.service | ||
| pyproject.toml | ||
| README.md | ||
| requirements.txt | ||

Nginx Live Traffic Monitor
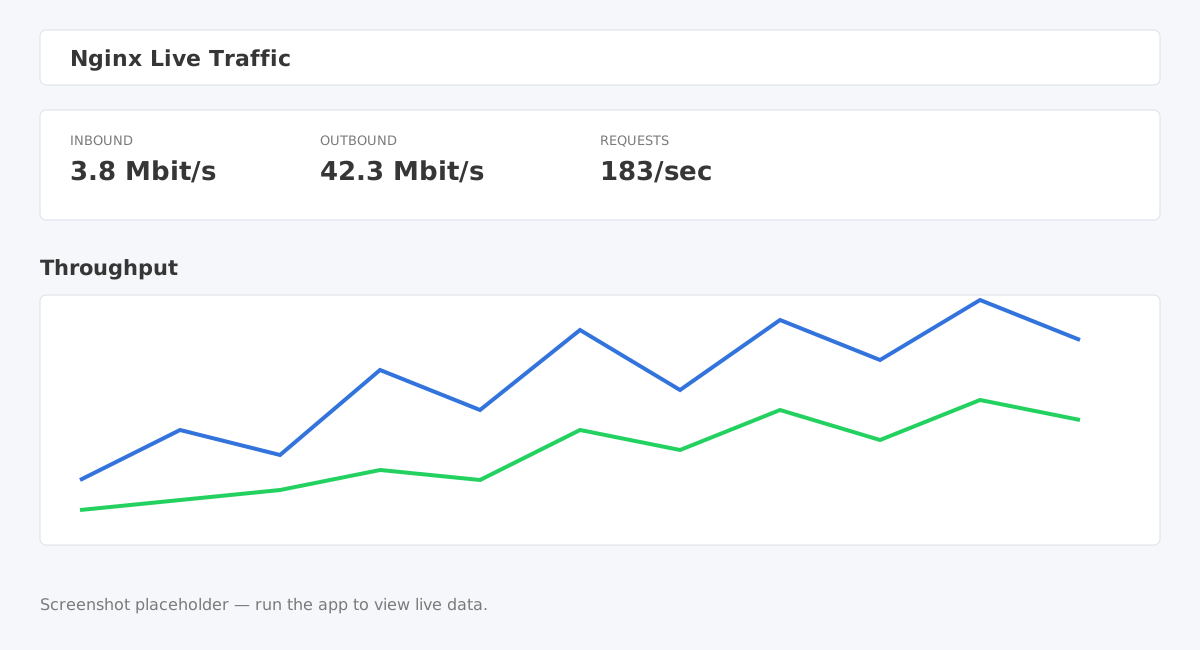
A small Python/FastAPI dashboard for seeing live traffic through an Nginx reverse proxy. It follows one dedicated access log, aggregates requests into bounded one-second in-memory buckets, and streams telemetry to browsers over Server-Sent Events. There is no database or persistent application telemetry.
Requirements and installation
Python 3.10+ is required. From a checkout:
python3 -m venv .venv
. .venv/bin/activate
pip install -r requirements.txt
Bulma and Chart.js are vendored under app/static/vendor, so the dashboard does not require browser access to a public CDN.
Nginx log format
Add the dedicated log (the application does not change Nginx configuration):
log_format traffic_json escape=json
    '{"timestamp":"$msec","host":"$host",'
    '"method":"$request_method","status":"$status",'
    '"incoming":"$request_length","outgoing":"$bytes_sent",'
    '"request_time":"$request_time",'
    '"upstream_response_time":"$upstream_response_time",'
    '"client_address":"$remote_addr","path":"$uri"}';

access_log /var/log/nginx-traffic/traffic.log traffic_json;
For an existing installation, deploy the updated dashboard first, then replace the dedicated log format and its access_log directive, run sudo nginx -t, and reload with sudo systemctl reload nginx. The parser supports mixed JSON and original whitespace records during migration. Original records still contribute to the table but display “Unavailable” for client address and path. No historical logs are replayed.
The client address is Nginx's $remote_addr. Behind a proxy, it may be the proxy address unless trusted real-IP handling is already configured in Nginx. The path is normalized $uri, which can reflect rewrites; query parameters, headers, and request bodies are not captured. All JSON values in this format are strings, including numeric fields.
The follower tolerates malformed lines, - upstream times, multiple upstream values, temporary disappearance, and rename/replacement rotation. It starts at the end of an existing file, like tail -F, so old log history is not mistaken for live traffic. The application keeps only configured rolling buckets (and bounded latency samples); totals are from application startup.
Running
python -m app.main
Open http://127.0.0.1:8080. Configuration is available through flags or environment variables:
| Setting | Flag | Environment variable | Default |
|---|---|---|---|
| Traffic log | --log-path |
TRAFFIC_LOG_PATH |
/var/log/nginx-traffic/traffic.log |
| Listen address | --host |
LISTEN_ADDRESS |
127.0.0.1 |
| Listen port | --port |
LISTEN_PORT |
8080 |
| Retention seconds | --retention |
TELEMETRY_RETENTION |
3600 |
Example:
TRAFFIC_LOG_PATH=/var/log/nginx-traffic/traffic.log LISTEN_ADDRESS=0.0.0.0 LISTEN_PORT=8080 \
  python -m app.main --retention 3600
The visible window can be set to 1 minute, 5 minutes, 15 minutes, or 1 hour. A new browser receives enough current history to fill its selected graph window. Host names are discovered automatically and can be selected for breakout graphs. Theme selection (system, light, dark) is stored in browser local storage.
Top 10 Requests
The table updates every second and follows the selected chart window. Each completed request appears once, ranked by the larger of its inbound request size and outbound response size. Its arrow and size indicate that direction; ties use inbound. Equal sizes sort by newest completion timestamp and then newest ingestion ID. Sizes use decimal units, with exact byte counts on hover.
Click a row (or focus it and press Enter/Space) to open request details, including both byte counts. Details are a frozen snapshot: table updates, expiration, window changes, and reconnections do not change an open overlay. Close it with the close button, Escape, or the backdrop. “Copy all details” copies labeled text including exact bytes; if clipboard access is unavailable, selectable text appears for manual copying.
Requests appear only after Nginx writes their completion log entry. This is not a view of uploads/downloads currently in progress. Request sizes include the bytes counted by $request_length and $bytes_sent; existing throughput metrics still attribute those bytes to the completion second.
Request tracking retains at most ten records per second for up to one hour, limited by configured retention; restarts clear it. Both /api/telemetry and /api/events include top_requests_by_window, mapping "60", "300", "900", and "3600" to up to ten full request records. Each record contains a process-local id, timestamp, host, method, client_address, path, status, incoming, outgoing, request_time, upstream_time (average), direction, and size (larger byte count). Missing client address, path, or upstream timing is null.
tmpfs and permissions
One possible tmpfs setup is:
sudo install -d -o nginx -g nginx -m 0750 /var/log/nginx-traffic
sudo mount -t tmpfs -o size=64M,mode=0750,uid=nginx,gid=nginx tmpfs /var/log/nginx-traffic
The service account needs search/read permission on the directory and read permission on traffic.log. If Nginx writes as another group, grant the monitor account group access or use an ACL, for example:
sudo setfacl -m u:nginx-monitor:rx /var/log/nginx-traffic
sudo setfacl -m u:nginx-monitor:r /var/log/nginx-traffic/traffic.log
systemd
Copy the included nginx-traffic-monitor.service to /etc/systemd/system/, adjust WorkingDirectory, virtualenv path, and the User/Group to match the installation, then:
sudo systemctl daemon-reload
sudo systemctl enable --now nginx-traffic-monitor
sudo systemctl status nginx-traffic-monitor
The service should run as an unprivileged account. Put a reverse proxy or firewall in front of it if it must be accessed beyond localhost; this utility intentionally has no authentication.
Development
Run the focused parser/aggregation tests with:
pytest -q
The server task follows the path by inode, drains currently available data from a renamed file, and reopens a replacement. A missing path is retried without busy polling. The publisher sends one compact snapshot per second to each SSE subscriber, and disconnecting clients are removed automatically.